A crash course in Data Science
First off, let’s define the difference between statistics and data science.
Statistics like to have models that are clear and applies systematic procedures.
Data science uses statistics, can deal with multiple models and doesn’t have to be straightforward. A data scientist would need a deep understanding of computer science, statistics and a good level of communication.
Supervised vs unsupervised learning
Supervised: Rely on old data to make predictions on new data (per example, using Machine Learning linear regression to determine the fruits in a basket, whether they were oranges, apples or bananas)
Unsupervised: Rely on data to learn its structure without using explicitly-provided labels (per example, using Machine Learning clustering algorithms to group all similar fruits, though it doesn’t know what they are: oranges, apples, bananas)
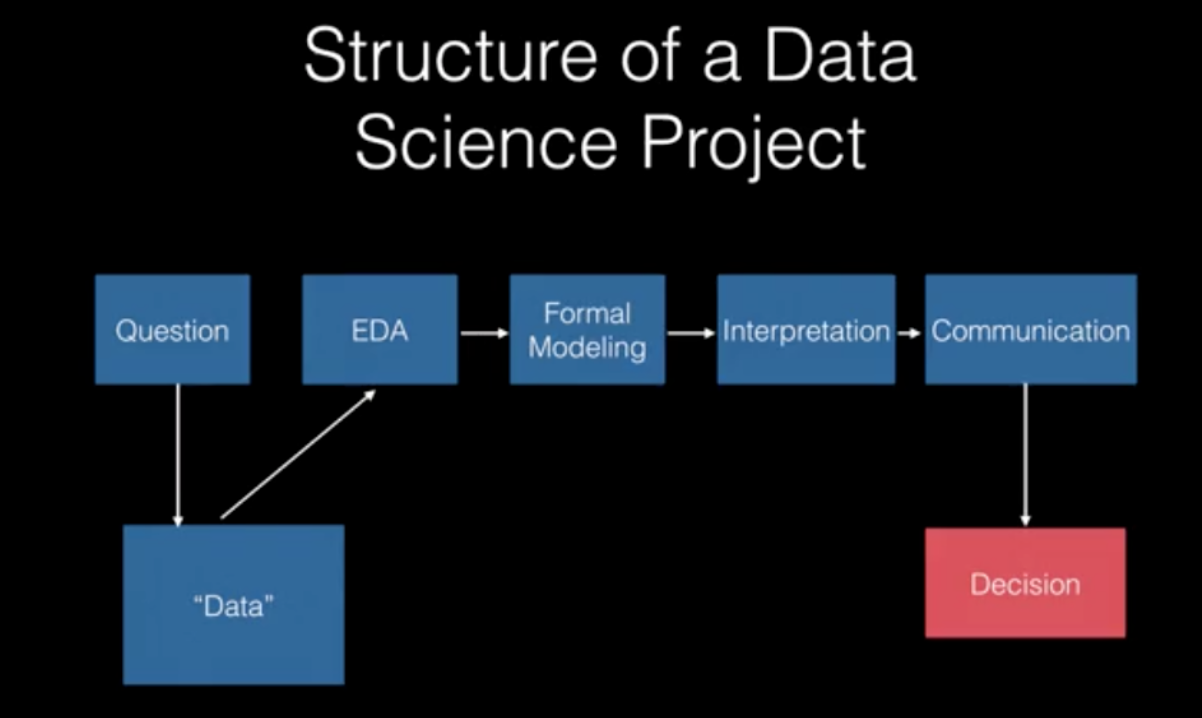
Structure of a Data Science project

One very important aspect in the above approach that is worth detailing is Exploratory Data Analysis that comprises 2 main goals:
1- Is the data that you have suitable for answering the question that you have.
Then so this will depend on a variety of factors depending on very basic information such as is there enough data, are there too many missing values, to more fundamental ones, like are you missing certain variables or do you need to collect more data to get those variables, etc?
2- Start to develop a sketch of the solution.
If the data are appropriate for answering your question, you can start using it to sketch out what the answer might be to get a sense of what it will look like (example: basic decision tree to identify patterns).
The output of a Data Science project
The four secrets of a successful Data Science project
Is the project about hype or has a real impact
Answer the below to define if the project is about buzzwords or a real contribution:
1- What is the question you are trying to answer?
2- Do you have the data to answer the question?
3- If you could answer the question, could you use the answer? (example: The winner of Netflix prize increased 10% the accuracy to predict how much they are going to enjoy a movie based on their preferences, but computing power was huge so they ended not using it)